- Creating a Dashboard
- Add and Edit Widgets
- Filter and group your charts by dimensions
- Dates and Filters
Default Dashboard
When accessing Dashboards, a default Dashboard will be loaded based on your organization’s main goal in AMP: Full Funnel, Performance, Branding or Lead Gen.
This default Dashboard is fully editable but we recommend creating one from scratch to better suit your specific needs. Don’t forget to add your brand logo by clicking on the image located at the top left corner of the Dashboard.

Creating a Dashboard
To create a new Dashboard, follow these steps:
-
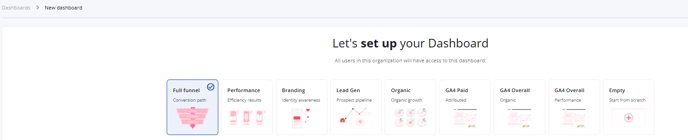
Access the leftsidebar and click on the last icon.
-
Choose a template based on your business objective. These templates include the most popular metrics related to that objective. If you prefer, you can select a blank canvas to start from scratch.
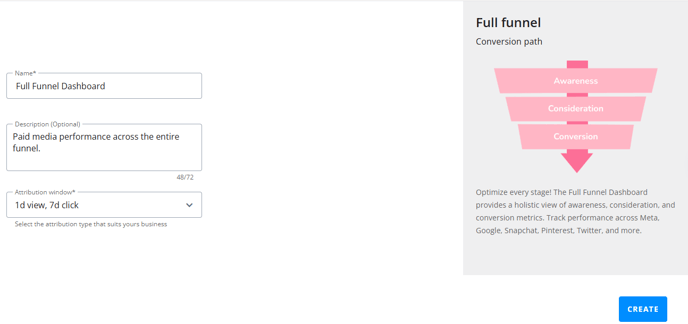
Once you’ve selected the template:
-
Assign a name, description and choose the attribution window you want to set (you can edit this later).
-
Click the “Create” button in the bottom right corner to generate the Dashboard.
It’s important to choose a title and description that help you easily identify the Dashboard, since you can now have multiple Dashboards simultaneously. To set your default Dashboard:
-
Click on the second icon in the left sidebar.
-
In the list of created Dashboards, click on the three dots next to the desired Dashboard and select “Set as default” so it loads automatically when you open the tool.
Add and Edit Widgets
Dashboards features an updated system for creating and editing Widgets. You can now choose from different types of visualizations and define the metrics you want to display in each widget.
For example, if you want to create a bar and line chart to view the relationship between the number of purchases and ROAS:
-
Click on the “New Widget” button in the top right corner.
-
In the window that opens, select the type of widget.
-
Next, select the data source from which you want to display the data. In this case Paid Platforms.
-
Select the two metrics for the chart: "purchases" for the bars and "ROAS" for the lines.

You’ll see a preview of the widget in the bottom section to make sure it’s correctly set up before adding it to the Dashboard. When you're satisfied with the widget, click the “Create” button in the bottom right corner.
-4.png?width=688&height=425&name=unnamed%20(1)-4.png)
When you're satisfied with the widget, click the “Create” button in the bottom right corner.
Widgets are added to the bottom of the page by default, but you can easily reorganize your Dashboard by dragging and dropping widgets from the top section. This intuitive drag-and-drop system allows you to customize your Dashboard layout effortlessly.

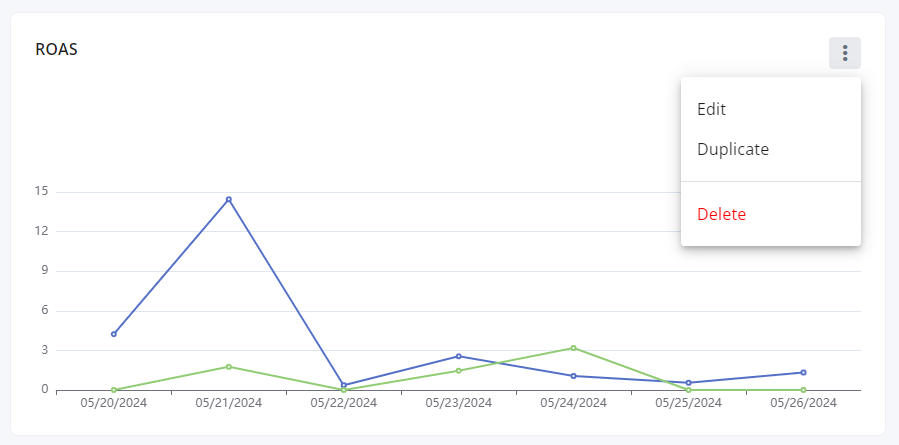
To edit, duplicate, or delete a widget, click the three dots in the corner of each widget.
Filter and group your charts by dimensions
In addition to adding metrics to your widgets, you can filter and group your charts by different dimensions. This feature is useful for comparing performance across segments such as platforms, objectives, countries, campaign names, or time ranges.
When you select a widget, the filter and group-by functionalities will be available.
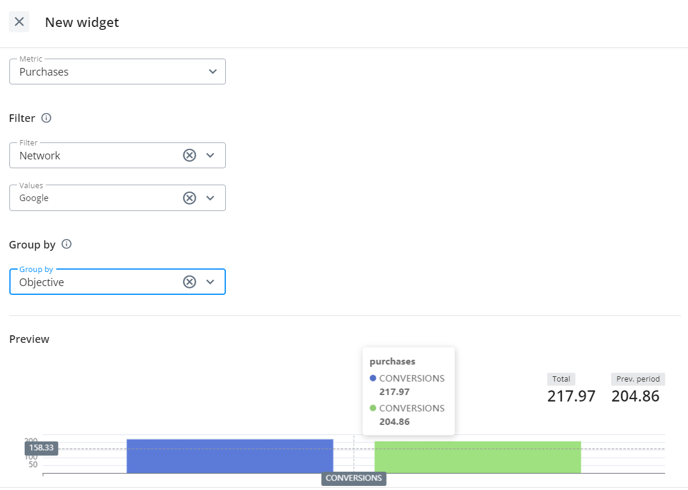
For example, with a bar chart, the "Filter" and "Group By" options will appear in the interface. Here, you can choose from all available dimensions. For example, you can create a bar chart with only Google data grouped by campaign objective:
-
Select the bar chart widget.
-
Set the metric as Purchases.
-
In the Filter section, choose Network as the dimension, then select Google from the dropdown.
-
In the Group By section, choose Objective as the dimension.
Dates and filters
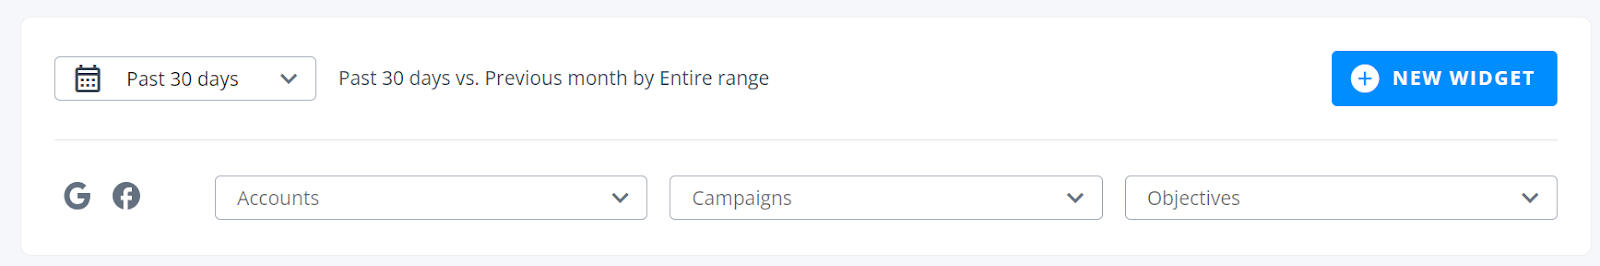
At the top of the Dashboard, you’ll find three filters available along with the date selector. You’ll also see the logos of the platforms where you’ve had ad spend during the selected date range.
In the date selector, you can choose from several presets by clicking the dropdown. Keep in mind that the comparison date range will always be the period prior to the one selected (e.g., vs previous week, vs previous month).
You can also filter the Dashboard data by your ad accounts, campaign names, or campaign objectives.
Enable GA4 metrics
Add GA4 metrics such as sessions, purchases, ROAS, and total users to your Dashboards and compare results attributed to each of the channels used in your ad campaigns.
To enable GA4 metrics in Dashboards v2, follow these steps:
Once we receive your ticket, we’ll review the setup to ensure it’s correct and enable the feature so you can start adding GA4 metrics to your widgets in Dashboards v2.